Sydney houses surpass $1 million median with 7.58% three-month jump
Posted on Monday, August 31 2015 at 3:14 PM
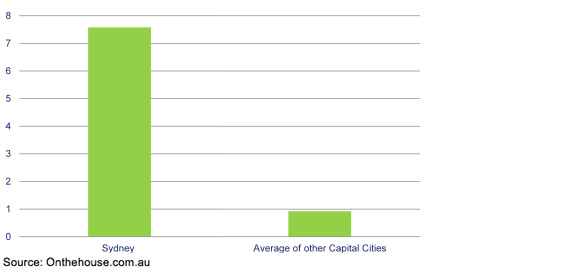
Research released today by Onthehouse.com.au has revealed that Sydney’s housing market has surpassed even its own average quarterly growth rate of 3.05 per cent, recording an astonishing 7.58 per cent in the three-month period ending July 2015.
The average
quarterly growth rate of all other capital city housing markets was just 0.92
per cent.
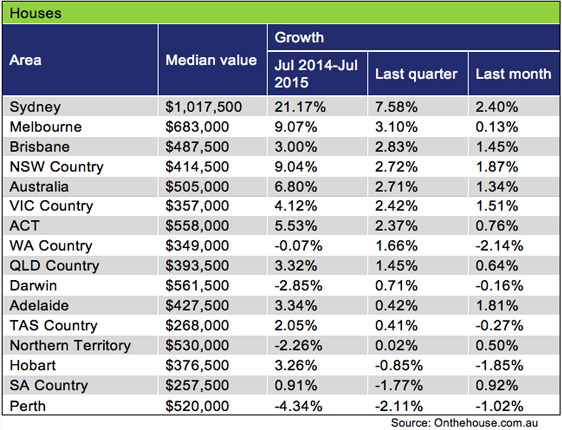
This huge increase
in value has pushed Sydney’s housing market through the million-dollar benchmark,
with the median house now valued at $1,017,500.
The following
graph demonstrates the July 2015 quarter capital growth rates for houses in
Sydney and other capital cities:
Market analyst at
Onthehouse.com.au Eliza Owen says: “As the growth in Sydney continues to
accelerate, there is insufficient evidence attributing foreign investment and
tax structures to this surge. However, there is another force to consider –
population convergence, a theory utilised by urban studies theorist Richard
Florida in 2005.
“Florida found
that population and economic activity were converging to a few large cities
around the world and evidence suggests that Sydney could be one of these
cities. If this is indeed the case, it signals that the growth is likely to
continue in the same way we’ve seen values and rents skyrocket in other cities
over the last few decades, including Singapore, New York, London and Tokyo.
“Assuming Florida
is correct in his theory of population convergence, Sydney could see strong
house value increases over the next few quarters before stabilising at a level
that even the most wealthy and mobile will find excessive,” Owen says.
Melbourne and
Brisbane were the only other capital city housing markets that documented a
steady quarterly growth performance, recording 3.10 per cent and 2.83 per cent
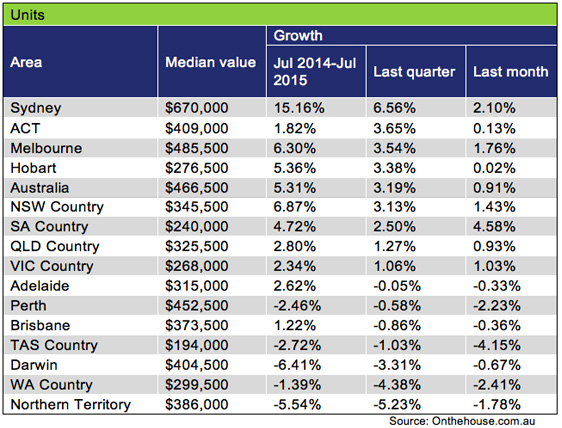
growth respectively. However, an overhang of stock in the Brisbane unit market
saw values drop by 0.86 per cent during the same period.
The worst
performing regions in the quarter to July were once again the resource states,
as Perth houses contracted 2.11 per cent (-4.34 per cent annually) and Darwin
unit values fell by 3.31 per cent (-6.41 per cent annually).
The following
table demonstrates the July market performance for houses across Australia,
ranked in order of quarterly growth:
The following
table demonstrates the July market performance for units across Australia,
ranked in order of quarterly growth:
Article source: http://feedproxy.google.com/~r/API_Property_News/~3/xqmR_yxtkK4/sydney-houses-surpass-$1-million-median-with-7.58-three-month-jump